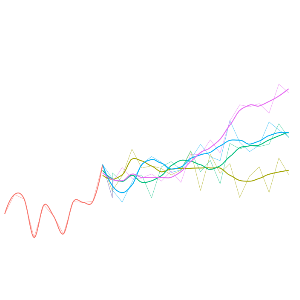
A collection of interactive data visualizations developed using R, Shiny, and ggplot2 to communicate the local impact of climate change to students in Washington State. We have a particular interest in ocean health, and how that will not only affect the environment, but the economic state of Washington as well.